Zhu, Y., Chen, J., Bi, X., Kuhlmann, G., Chan, K. L., Dietrich, F., Brunner, D., Ye, S., and Wenig, M.: Spatial and temporal representativeness of point measurements for nitrogen dioxide pollution levels in cities, Atmos. Chem. Phys. Discuss., doi.org/10.5194/acp-2019-1198, 2020.
Abstract. In many cities around the world the overall air quality is improving, but at the same time nitrogen dioxide (NO2) trends show stagnating values and in many cases could not be reduced below air quality standards recommended by the World Health Organization (WHO). Many large cities have built monitoring stations to continuously measure different air pollutants. While most stations follow defined rules in terms of measurement height and distance to traffic emissions, the question remains, how representative are those point measurements for the city-wide air quality. The question of the spatial coverage of a point measurement is important because it defines the area of influence and coverage of monitoring networks, determines how to assimilate monitoring data into model simulations or compare to satellite data with a coarser resolution, and is essential to assess the impact of the acquired data on public health.
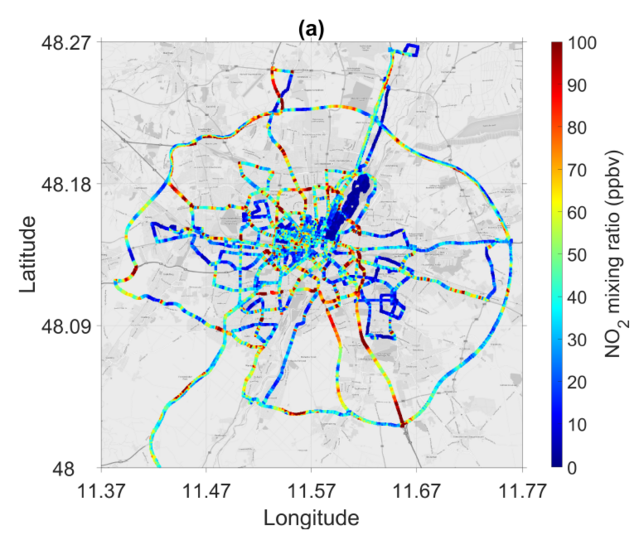
In order to answer this question, we combined different measurement data sets consisting of path averaging remote sensing data and in-situ point measurements in stationary and mobile setups from a measurement campaign that took place in Munich, Germany in June and July 2016. We developed an algorithm to strip temporal diversity and spatial patterns in order to construct a consistent NO2 pollution map for Munich. Continuous long-path differential optical absorption spectroscopy (LP DOAS) measurements were complemented with mobile cavity-enhanced (CE) DOAS, chemiluminescence (CL) and cavity attenuated phase shift (CAPS) instruments and were compared to monitoring stations and satellite data. In order to generate a consistent composite map, the LP DOAS diurnal cycle has been used to normalize for the time of the day dependency of the source patterns, so that spatial and temporal patterns can be analyzed separately. The resulting concentration map visualizes pollution hot spots at traffic junctions and tunnel exits in Munich, providing insights into the strong spatial variations. On the other hand, this database is beneficial to the urban planning and the design of control measures of environment pollution. Directly comparing on-street mobile measurements in the vicinity of monitoring stations resulted in a difference of 48 %. For the extrapolation of the monitoring station data to street level, we determined the influence of the measuring height and distance to the street. We found that a measuring height of 4m, at which the Munich monitoring stations measure, results in 16 % lower average concentrations than a measuring height of 1.5 m, which is the height of the inlet of our mobile measurements and a typical pedestrian breathing height. The horizontal distance of most stations to the center of the street of about 6 m also results in an average reduction of 13 % compared to street level concentration. A difference of 21 % in the NO2 concentrations remained, which could be an indication that city-wide measurements are needed for capturing the full range and variability of concentrations for assessing pollutant exposure and air quality in cities.